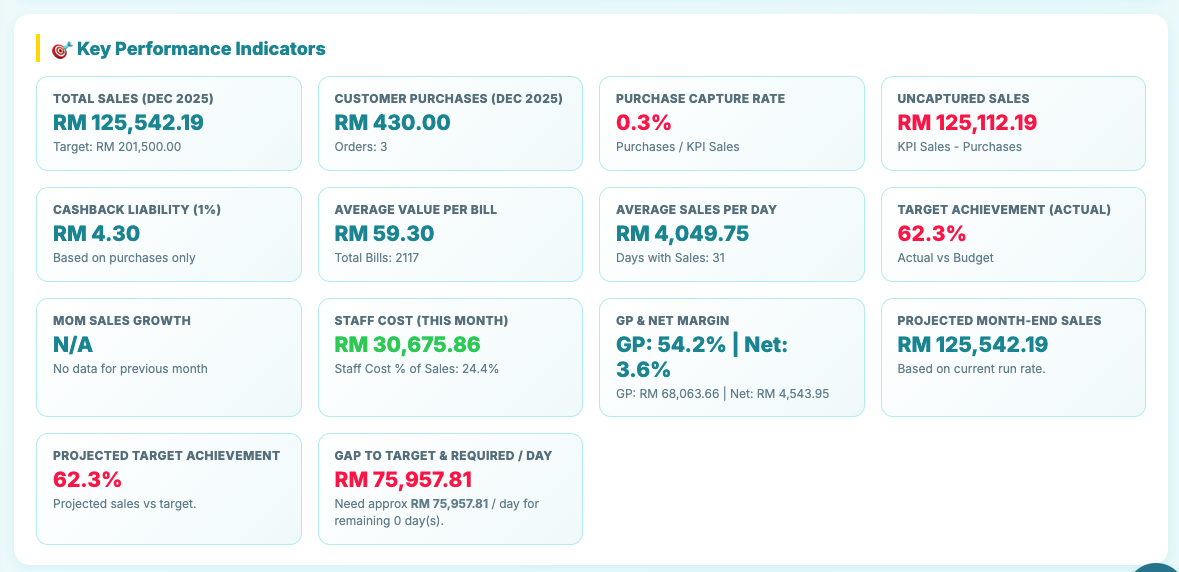
3) Key CEO Metrics (What You Must See Weekly)
If your weekly view is missing these, you are managing blind. Below is a CEO-ready set of metrics AiServe can generate.
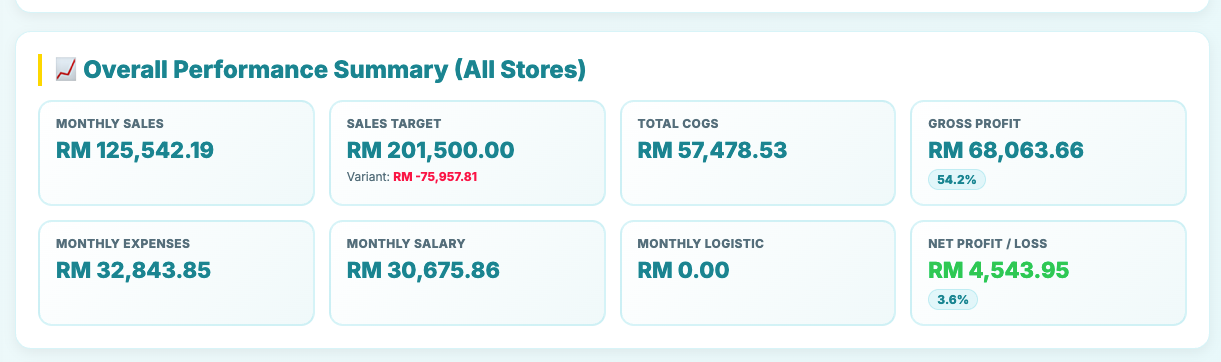
Cashflow Control
7 Days
Weekly inflow/outflow & cash runway signals.
Gross Margin
%
Margin by outlet / product / category to stop leakage.
Break-even
1 View
Revenue needed to cover fixed costs + staff costs.
Outlet Ranking
#
Top/bottom outlets by profit, efficiency, growth.
Staff Productivity
%
Sales per staff / shift performance / incentives.
Exceptions & Alerts
⚠
Detect anomalies: sudden drops, abnormal costs, missing reports.
CEO Rule: If it’s not measurable, it’s not manageable.
AiServe turns daily WhatsApp conversations into structured records, then into dashboards and weekly summaries.
P&L Trend Dashboard
Outlet Comparison
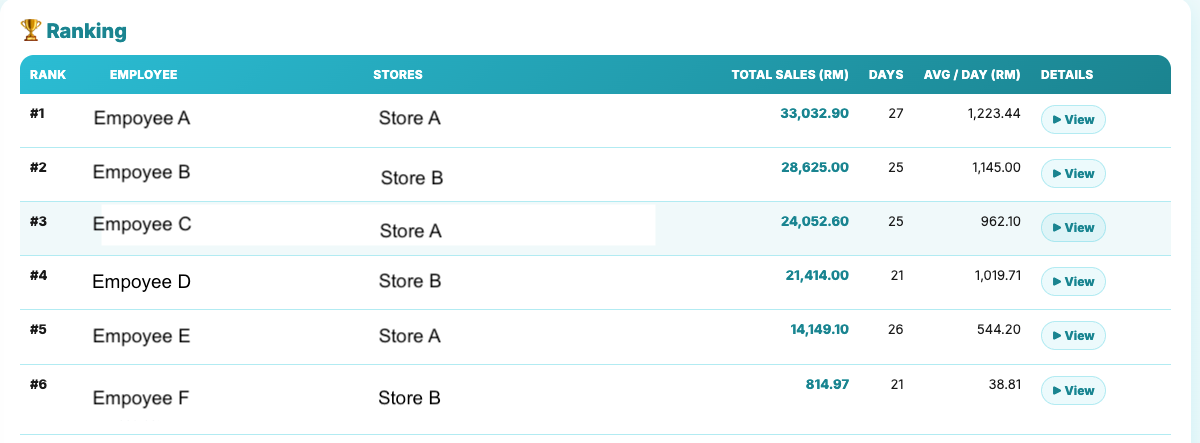
Staff Productivity
Tip: put real screenshots here (blur numbers if needed). CEOs care that the screen exists.